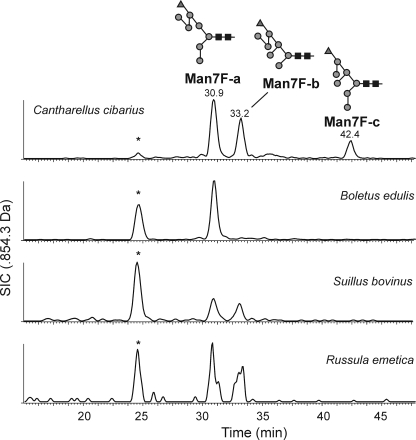
FIGURE 2.
Chromatographic comparison of selected N-glycans from different mushroom species. Reduced N-glycans from chanterelles, penny buns, and other species were subjected to PGC-LC-ESI-MS. The selected ion chromatogram for Man7Fuc is shown. The peaks at 25 min labeled with an asterisk were caused by in-source fragmentation of Man9. The figures follow the Consortium for Functional Glycomics guidelines. Black squares represent GlcNAc; gray circles, mannose; and gray triangles, fucose.

