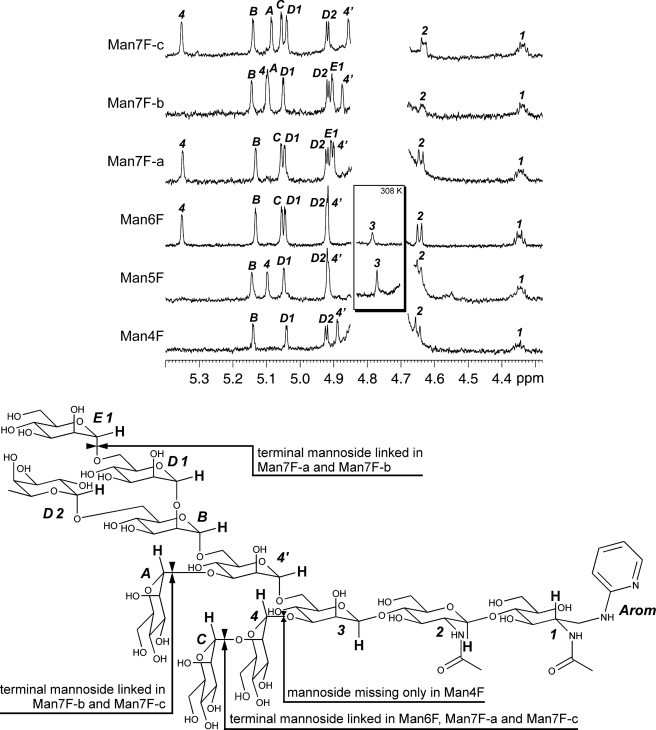
FIGURE 4.
Proton NMR measurements of the isolated oligosaccharides. The frequency region with indicative signals of all saccharide units is shown, and these protons are highlighted in the structure scheme. Spectra have been recorded at 298.0 K. Additional measurements of Man5Fuc and Man6Fuc have been made at 308.0 K to cause a high field shift of the HDO signal. H-1 proton signals of β-Man [3] can hence be detected and are shown in the inset. Selected indicative 1H shifts of the isolated oligosaccharides are given in the supplemental NMR Data. The drawing at the bottom shows a fictive Man8Fuc, including all saccharide units occurring in the measured compounds. The distinctive units of each isolated oligosaccharide are specified. Proton atoms labeled in bold caused indicative 1H NMR signals. The numbering of saccharide units refers to Van Halbeek et al. (25).

