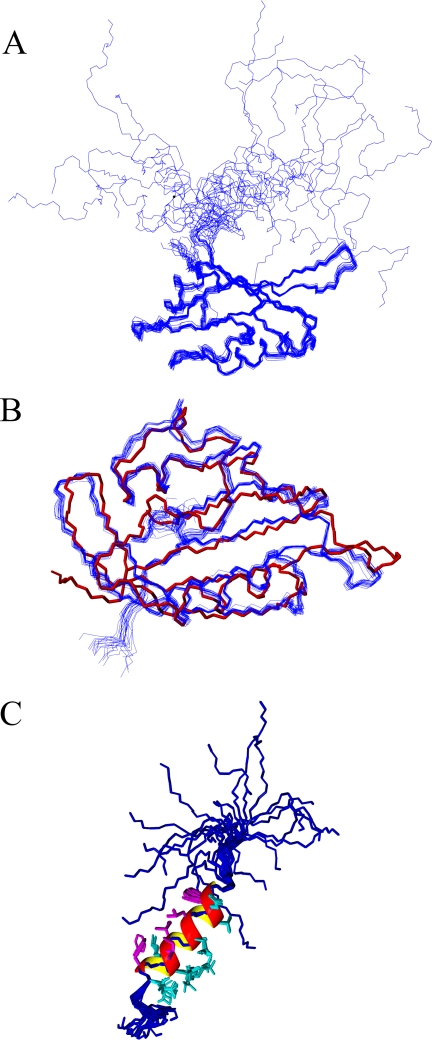
FIGURE 1.
Structure of the NT1–26 domain of hERG. A, superposition of the protein backbone (Ser26 to Val132) for the family of 20 lowest energy structures calculated using AMBER. B, comparison of the protein backbone of the PAS domain crystal structure (red, Protein Data Bank accession code 1BYW) with the family of NMR structures (blue). C, peptide backbones (blue) of Met1–Gln25 from the 20 NMR structures in A superimposed to illustrate the amphipathic helix extending from Glu11–Gly24. The helix is represented by a ribbon with the hydrophobic residues in magenta and the charged or polar residues in cyan. For clarity, only the side chains of residues in the helix are shown.

