FIGURE 3.
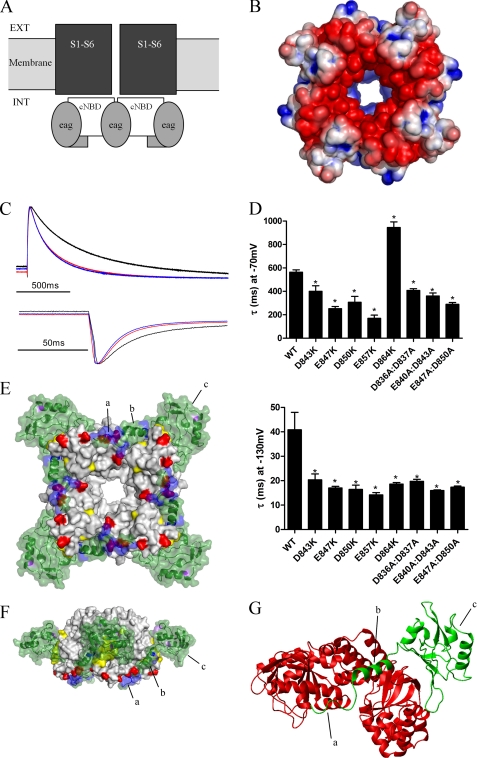
Deactivation is regulated by electrostatic interactions between the NT1–26 domain and the cNBD. A, schematic representation of structural domains of the hERG channel, illustrating the intracellular location of the cNBD (and C-linker) with respect to the transmembrane pore and voltage sensor domains (S1–S6). Ext, extracellular; Int, intracellular. B, surface view of the homology model of the cNBD of hERG with residues colored (as in Fig. 2A) according to their electrostatic potential. C, representative current traces (normalized to the peak tail current amplitude) to enable comparison of tail current time courses for WT hERG (black), E847K (red), and E857K (blue). D, time constants for deactivation for cNBD mutant currents, measured as described previously. Most mutations accelerated deactivation at both −70 and −130 mV. D864K was unusual in that deactivation at −70 mV was slowed. Asterisk indicates time constants that are significantly different from WT hERG (p < 0.05, n = 5). E, modeled complex of the EAG domain (green) and the cNBD and C-linker. Four molecules of the EAG domain interact with the tetrameric cNBD. Residues in purple and yellow are those mutated by Al-Owais et al. (23), and residues in red are acidic, and residues in blue are basic. Label a is the unstructured Met1–Pro10 region; b is the amphipathic helix (Gln11–Gly24), and c is the PAS domain. F, modeled complex rotated 90° about the horizontal axis and 45° about the central vertical axis relative to the image in E. G, expanded view of part of modeled complex showing interactions of one EAG domain (green) with two cNBDs (red). The C-linker is not shown. The NT1–26 amphipathic helix (b) sits in a cleft at the interface of two adjacent cNBDs. The unstructured Met1–Pro10 region interacts with the C-helix of one of the cNBDs.

