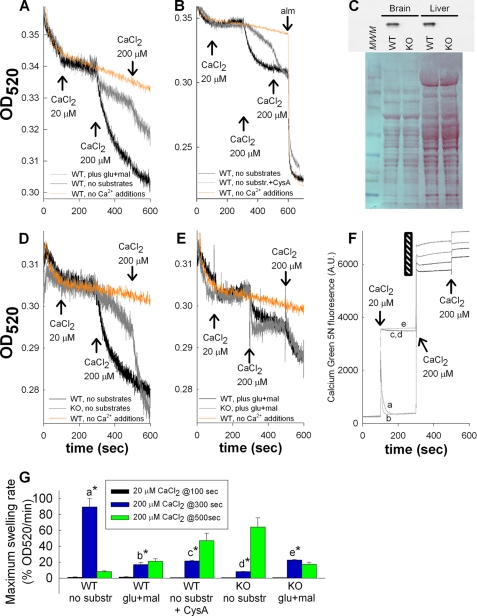
FIGURE 1.
Effect of substrate availability on Ca2+-induced PTP and modulation by cyclosporin A or genetic deletion of cyclophilin D. A, B, D, and E, traces of light scatter recorded spectrophotometrically in mitochondrial suspensions at 520 nm during CaCl2 additions at the concentrations indicated in the panels. Conditions are given in the panels. C, Western blot (upper panel) of brain and liver mitochondria from WT versus cypD-KO mice probed for cypD immunoreactivity. Lower panel, Ponceau S staining of the same blot shown in the upper panel. MWM, molecular weight marker. D and E are aligned on the y axis. A, D, E, and F are aligned on the x axis. F, mitochondrial Ca2+ uptake followed by Calcium Green 5N hexapotassium salt fluorescence (noncalibrated). The black striped region is expanded on the y axis, for the sake of clarity; a, WT plus glutamate plus malate; b, WT plus glutamate plus malate plus cys A; c, WT, no substrates; d, WT, no substrates plus cys A; e, WT, no substrates plus Ru360. Results are representative of at least four independent experiments. G, maximum swelling rates pooled from all individual experiments (expressed as percentage of swelling rate per minute and accounting for the condition producing the highest swelling rate as maximum) for each condition and after each Ca2+ pulse. Error bars represent S.E.; a is statistically significant from b, c, d, and e, p < 0.001; d is statistically significant from e, p < 0.05, one-way ANOVA on Ranks.

