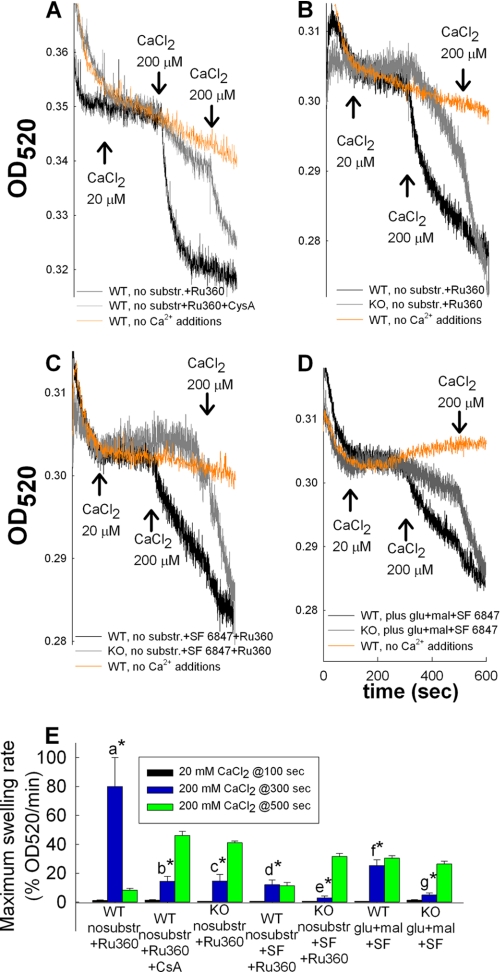
FIGURE 2.
Effect of SF 6847 and/or inhibitors of the Ca2+ uniporter on mitochondrial Ca2+ uptake; modulation by cyclosporin A or genetic deletion of cyclophilin D. Traces of light scatter recorded spectrophotometrically at 520 nm during CaCl2 additions at the concentrations are indicated in the panels, to mitochondrial suspensions. Conditions of the suspensions are given in the panels. All panels are aligned on the x axis. Results are representative of at least four independent experiments. E, maximum swelling rates pooled from all individual experiments (expressed as in Fig. 1) for each condition and after each Ca2+ pulse. Error bars represent S.E.; a is statistically significant from b, c, d, e, f, and g, p < 0.001; d is statistically significant from e, p < 0.05, one-way ANOVA on Ranks.

