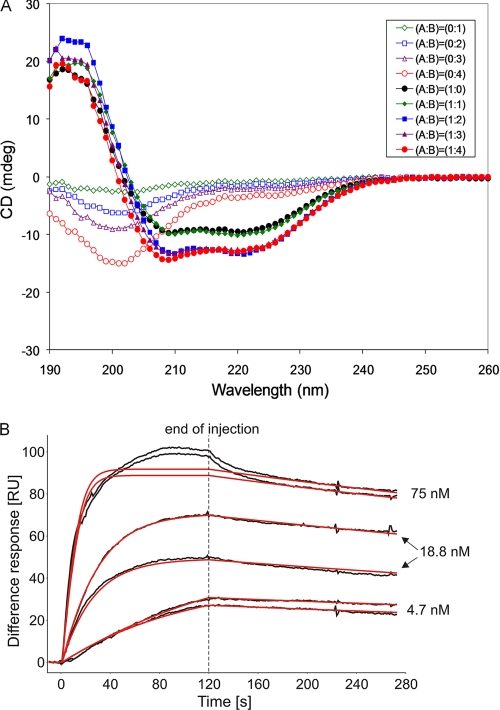
FIGURE 2.
Structural and functional assays. A, CD spectra of His6-C-SpoIISA and SpoIISB and their combination in various molar ratios. SpoIISA and SpoIISB are present at ratios of: 1:0 (filled black circles); 1:1 (filled green diamonds); 1:2 (filled blue squares); 1:3 (filled purple triangles); and 1:4 (filled red circles). The corresponding unfilled symbols represent the same concentrations of SpoIISB in the absence of His6-CSpoIISA. B, SPR analysis of binding of SpoIISB to the cytosolic domain of SpoIISA. Duplicate samples of SpoIISB at the concentrations indicated were injected over SpoIISA dimers immobilized on the sensor chip. The black lines are experimental binding sensorgrams, and the red lines are calculated binding curves fitted to a 1:1 model of interaction, assuming two independent binding sites on each SpoIISA dimer. The low overall chi square of fitting (1.8) indicated the appropriateness of the chosen interaction model. To further validate the approach, we simulated the SPR response for two nonequivalent binding sites on SpoIISA. The simulated curves largely diverged from the experimental data (not shown). Because of the incomplete regeneration of the CSpoIISA surface after the first injection of 18.8 nm SpoIISB, the second 18.8 nm SpoIISB replicate gives a lower response. Consequently, the maximal binding response parameter Rmax of SpoIISB was fitted locally during subsequent calculations of binding constants to take into account incomplete regeneration. Nonspecific binding occurred later in the injections of the highest SpoIISB concentration. The data from this region were not taken into account in the fitting.

