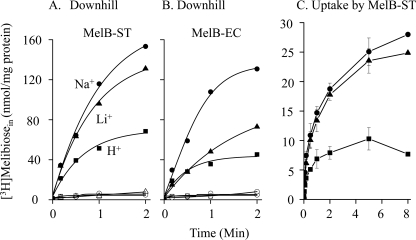
FIGURE 1.
[3H]Melibiose transport. A and B, downhill transport in DW2 intact cells with overexpressed MelB-ST (A) or MelB-EC (B). Calculated intracellular [3H]melibiose concentrations were plotted as a function of time. C, uptake with RSO vesicles containing MelB-ST. Square, circle, and triangle represent data that were obtained in the presence of H+, Na+, and Li+, respectively. Na+ or Li+ (20 mm) was added by premixing with [3H]melibiose. Error bars indicate S.E.

