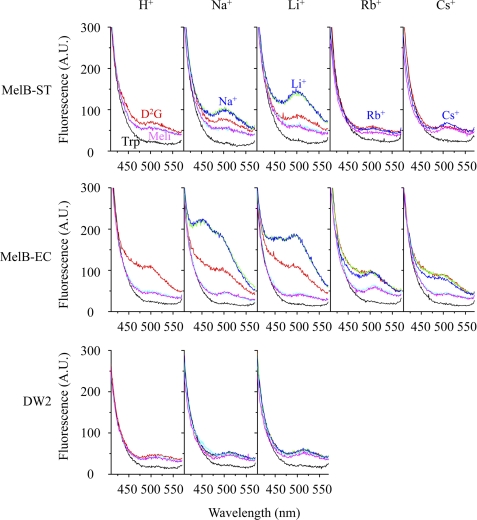
FIGURE 4.
FRET. RSO vesicles prepared from DW2 cells without or with MelB at a protein concentration of 0.5 mg/ml were excited at 290 nm. Emissions were plotted between 410 and 570 nm. Sugar and cation were added into RSO vesicles sequentially according to the following order: black lines, Trp emission; red lines, D2G emission (10 μm); green lines, Na+, Li+, Rb+, or Cs+ (20 mm); blue lines, Na+ or Li+ (20 mm), Rb+ or Cs+ (100 mm); cyan and magenta lines, melibiose (130 mm). In MelB-ST with Rb+, green and cyan curves were removed for clarity. Data were measured with Hitachi F-7000 fluorescence spectrophotometer. A.U., absorbance units.

