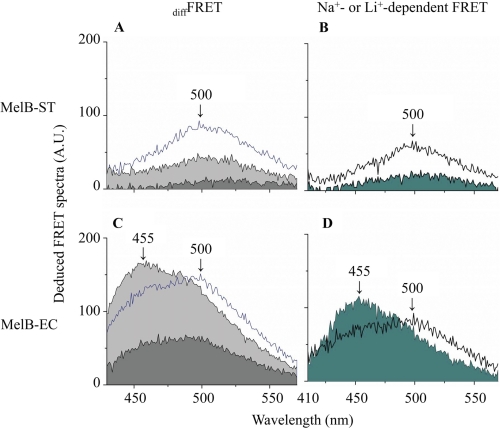
FIGURE 5.
Deduced FRET spectra. A and C, diffFRET emission before and after the addition of excess melibiose was calculated from Fig. 4. Curves filled with light or dark gray represent the deduced diffFRET spectra in the presence of Na+ or H+, and the open blue curves represent diffFRET spectrum in the presence of Li+. B and D, Na+- and Li+-dependent FRET were calculated by subtracting the H+-coupled diffFRET and plotting in filled and open curves, respectively. A.U., absorbance units.

