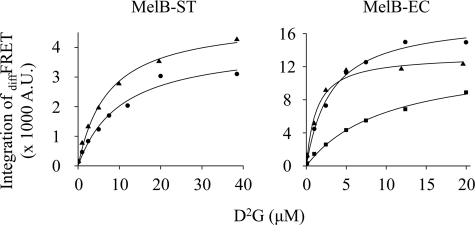
FIGURE 6.
appKd for D2G. Titration of D2G was measured by FRET in the presence of H+ (square), Na+ (circle), or Li+ (triangle) with Hitachi F-7000 fluorescence spectrophotometer. diffFRET representing the bound D2G was integrated between 460 and 540 nm for MelB-ST and 440 and 530 nm for MelB-EC, and the hyperbolic function was applied to fit data (Table 1). Poor D2G FRET signal in the absence of Na+ and Li+ precluded accurate measurements in MelB-ST. A.U., absorbance units.

