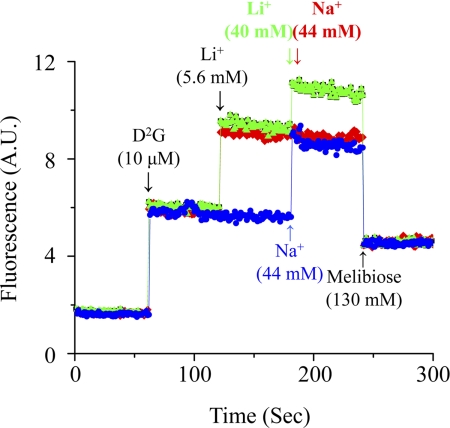
FIGURE 9.
Cation competition. On a time trace at λEx 290 nm and λEm 500 nm with SLM-8100/DMX fluorescence spectrophotometer, RSO containing MelB-ST was incubated with 5.6 mm Li+ (5-fold K0.5) after the addition of 10 μm D2G and followed by a saturated concentration of either Li+ (40 mm, green curve) or Na+ (44 mm, red curve) as the arrows indicate. As a control, Na+ (44 mm) was directly added without Li+ (blue curve). The FRET signals are displaced with 130 mm melibiose. A.U., absorbance units.

