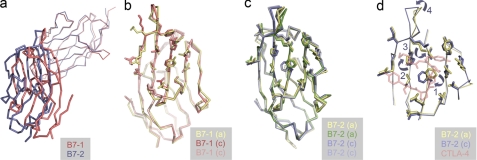
FIGURE 6.
Recognition of CTLA-4 by B7-1 and B7-2. In a, the shift in the positioning of the ligand-binding domain of B7-1 (red) versus that of B7-2 (blue) is illustrated after superimposing the CTLA-4 monomers from each structure (thin red and blue lines). The structures are shown as α-carbon representations. In b and c, the side chain positions of CTLA-4-contacting residues of B7-1 and B7-2, respectively, are shown for the apo (a) structures (B7-1, yellow; B7-2, yellow and green) and the complexed (c) structures (B7-1, red, light red; B7-2, blue and light blue). Only one copy of apo-B7-1 is shown because there was just the one molecule in the asymmetric unit of the apo-B7-1 crystals (12). In d, the systematic movements in Phe31 (labeled 1), His88 (labeled 2), and Met95 (labeled 3) that lead to repositioning of the FG loop of B7-2 (labeled 4) are illustrated for one copy each of the ligand-binding domains of B7-2 before (yellow) and after (blue) complex formation. The MYPPPY sequence of CTLA-4 is shown transparently in red.

