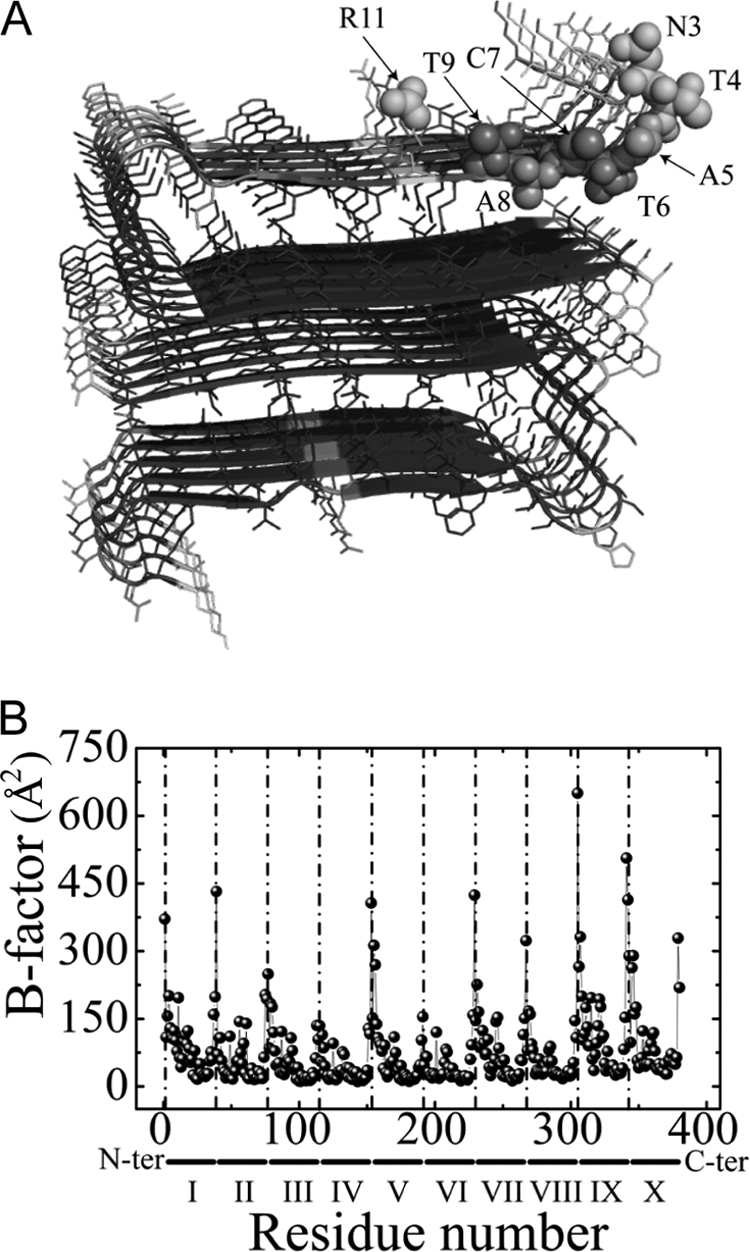
FIGURE 6.

MD simulations of the IAPP fibril models. A, three-dimensional structure of the fibril model (25) continuously colored according to the simulated B-factor values (35) in the range from 50 Å2 (blue) to 400 Å2 (red). The residues with backbone amide moieties observed in the high resolution MAS spectrum of hIAPP fibrils are shown in a full heavy atoms representation. B, simulated B-factors of individual monomers as calculated based on all heavy atom positions after fitting to the initial structure. All residues of ten monomers are plotted along the horizontal axis comprising 370 residues in total. The vertical dotted lines indicate the N terminus of each monomer.
