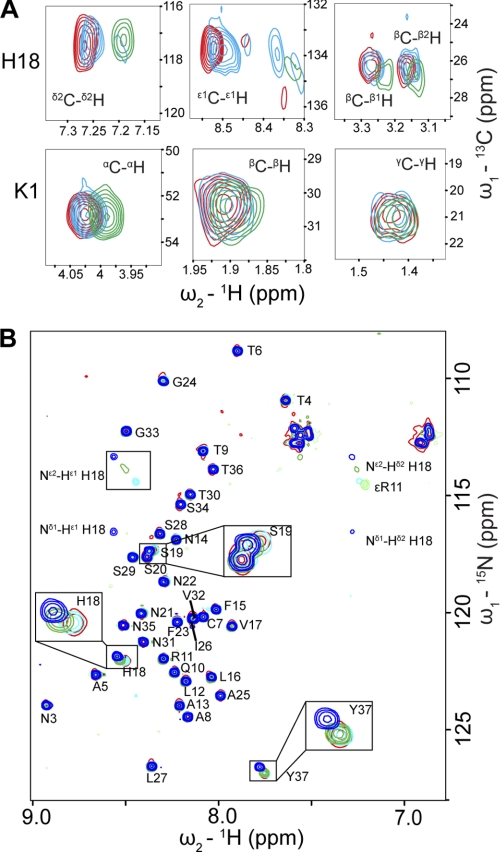
FIGURE 8.
Analysis of resveratrol and insulin binding to IAPP with NMR. A,[1H, 13C]-HSQC spectra of 50 μm IAPP alone (red) and in the presence of 40 μm (cyan) and 80 μm (green) resveratrol were recorded in pure H2O. His-18 and Lys-1 side-chains show distinct chemical shift changes upon resveratrol titration. B, [1H, 15N]-HMQC spectra of 20 μm IAPP alone (red) and in the presence of 10 μm (cyan), 25 μm (green), and 50 μm (blue) insulin were recorded in 5 mm sodium phosphate, pH 5.5, 5 mm NaCl, 3% D2O. His-18, Ser-19, and Tyr-37, which show evident chemical shift changes upon insulin titration are highlighted by rectangular boxes.

