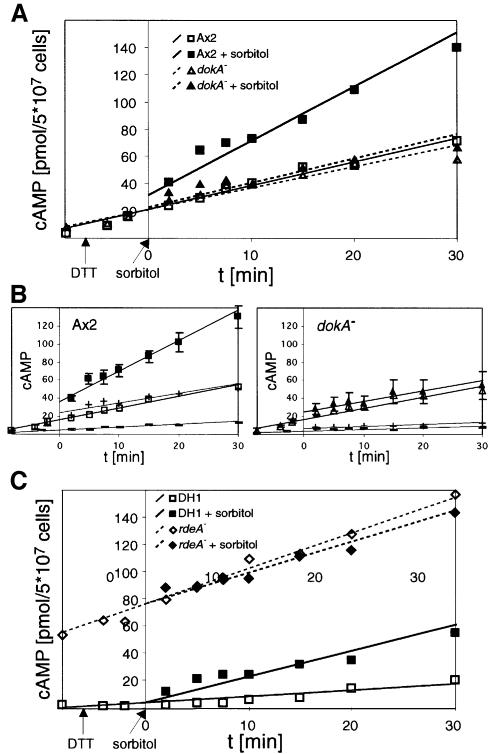
Fig. 6. (A) Concentration of total cAMP in D.discoideum cells in response to hyperosmotic stress. Ax2 cells show a markedly stronger increase in cAMP when exposed to high tonicity (filled squares) compared with cells in SPB (open squares), whereas the addition of sorbitol has no influence on total cAMP levels in dokA– cells (filled triangles in sorbitol buffer, open triangles in SPB). (B) Total cAMP levels of Ax2 and dokA– cells in SPB (open symbols) and sorbitol buffer (closed symbols) and the fraction of intracellular cAMP (–, in SPB; +, in sorbitol buffer), respectively. The amounts of cAMP in the buffer and in the cell pellets were determined in parallel and normalized on the total cAMP concentration. (C) Comparison of total cAMP concentrations in rdeA– cells and their parent strain DH1 in response to hyperosmotic stress. DH1 cells show an additional increase in 400 mM sorbitol (filled squares) compared with cells in SPB (open squares), while the elevated cAMP levels in rdeA– cells do not increase further (filled diamonds in sorbitol buffer, open diamonds in SPB). In all panels, the means of at least three independent experiments are shown; the lines represent best linear fits. In (B), standard deviations of the total cAMP levels are depicted. Measurements were performed with DTT as inhibitor of the extracellular PDE. Therefore, values cannot be compared with those in Figures 1A and 5A.

An official website of the United States government
Here's how you know
Official websites use .gov
A
.gov website belongs to an official
government organization in the United States.
Secure .gov websites use HTTPS
A lock (
) or https:// means you've safely
connected to the .gov website. Share sensitive
information only on official, secure websites.
