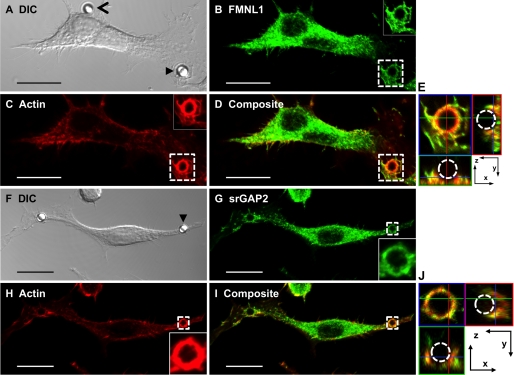
FIGURE 5.
Localization of FMNL1 and srGAP2 to the actin-rich phagosome during phagocytosis. Co-localization of FMNL1 (A–E) or srGAP2 (F–J) with F-actin during phagocytosis is shown. A and F, differential contrast image (DIC) of a RAW cell incubated with Fc-coated beads is shown. Closed arrowheads indicate a bead undergoing phagocytosis, and an open arrowhead indicates a nearby bead that is not being phagocytosed. Maximum projection images depicting immunolocalization of endogenous FMNL1 (B), srGAP2 (G), phalloidin-stained actin (C and H), or composite images (D and I) are shown. Insets correspond to boxed regions. E and J, images depict composite boxed regions from panels D and I. The central image, surrounded by blue in E and J is a 0.25-μm section from the z-stack. The images below and to the side of this section are orthogonal projections of the phagocytosis cup. The images to the bottom (surrounded by green) represent the image projected where the green line bisects the stack. The images to the right (surrounded by red) indicate the image projected where the red line bisects the stack. The blue lines seen in the images to the bottom and right are the z-position of the central image section. The scale bar represents 15 μm.

