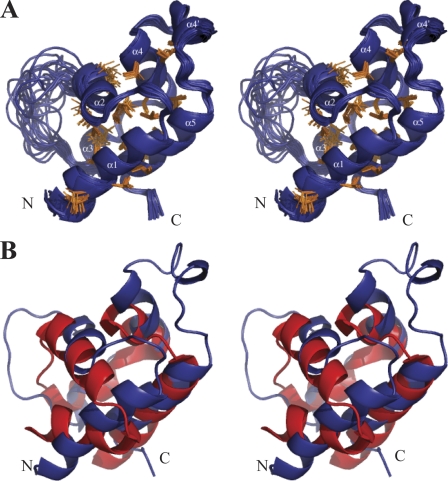
FIGURE 2.
NMR structure of n-NafY. A, stereo drawing of the 20 best structures. Hydrophobic side chains within the well structured region of the protein (residues 9–33 and 44–85) are shown in orange. B, structural overlay of n-NafY and the SAM domain that is the closest structural homolog (Ste11 from S. cerevisiae, Protein Data Bank code 1OW5).

