FIGURE 4.
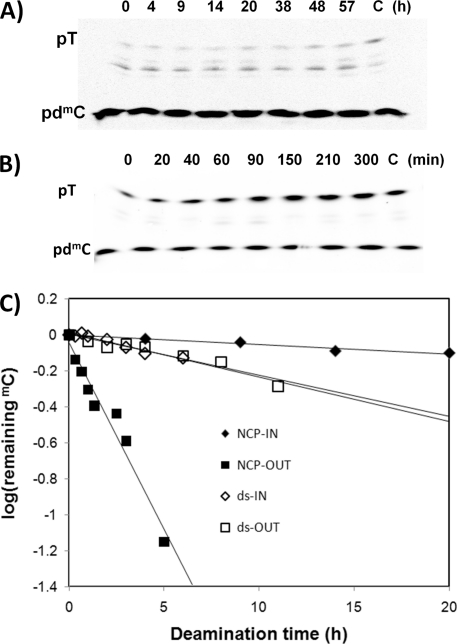
Deamination of the T=mC CPDs in the free and nucleosome-bound 150-mer DNA duplexes. Free or nucleosome-reconstituted 150-mer DNAs with internal 5′-32P-mdC labeling were irradiated for 1 h with 302 nm light and then allowed to deaminate for the indicated times in hours, after which they were phenol-extracted, photoreverted with E. coli photolyase, and then degraded with nuclease P1. The degradation products were first run on a 7 m urea, 10% acrylamide, 0.3% bisacrylamide gel in TBE (first dimension, downward direction) after which the band containing primarily mononucleotides was run on a 25% acrylamide, 0.8% bisacrylamide gel in 25 mm citric acid, pH 3.5 (second dimension, upward direction). A, representative second dimension gel of nucleosome-bound 150-mer ds-IN. B, representative second dimension gel of nucleosome-bound 150-mer ds-OUT. C, plots of log (fraction of TmC CPD remaining) as a function of different deamination times for the gels shown in A and B and for the free 150-mer ds substrates, after correcting for background 32P-T. Plots for other sets of independent measurements are given in supplemental Figs. S5 and S6. The intermediate bands in the gels shown in A and B are due to non-photorevertible photoproduct-containing trinucleotides and incomplete digestion products and do not significantly affect the rate measurements.

