
Fig. 2.
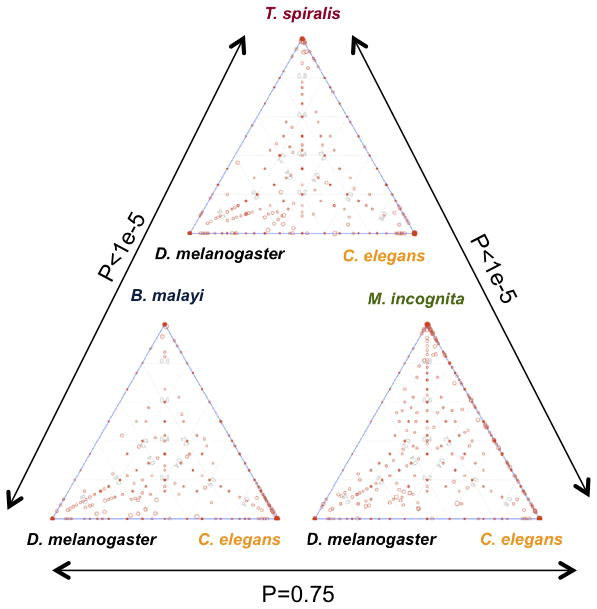
Comparison of orthologous protein families among nematodes that span the phylum. Orthologous families comprised of each of the three parasites and D. melanogaster and C. elegans are plotted separately. The size of the dot represents the size of the orthologous family; the position represents the composition of the family based on the three represented species. With the assumption that evolutionarily close species have similar orthologous family size (fewer duplications and deletions), these plots illustrate that T. spiralis is equally distinct from both C. elegans and D. melanogaster while the two other parasites share greater commonality with C. elegans. P-values (derived using Chi-square test in pair-wise plot comparison) indicate a greater number of families present in C. elegans compared to D. melanogaster, and show that significantly fewer families are biased to C. elegans when T. spiralis is present in the orthologous family