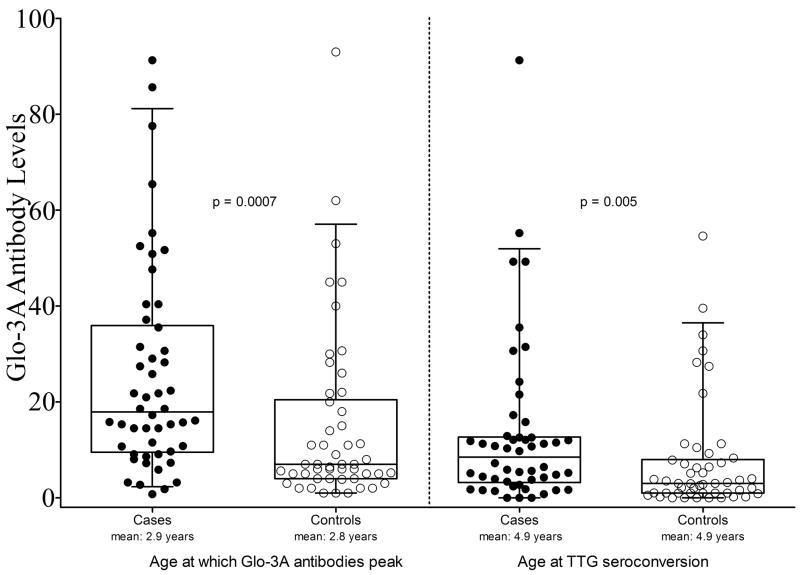
Figure 1.
Box and scatter plot of Glo-3A antibody levels at two visits: the age at which Glo-3A antibody levels peak in both cases and controls and the age at which TTG positivity is first identified in patients and age-matched controls. The p-values were generated from the t-tests on natural log transformed Glo-3A levels but the box plots and scatter plots present the actual (untransformed) levels. From bottom to top, the horizontal lines in the box plots represent the 5th percentile, the 25th percentile, the mean, the 75th percentile, and the 95th percentile, respectively. Filled circles (●) represent Glo-3A levels in individual cases, Open circles (○) represent Glo-3A levels in controls.

