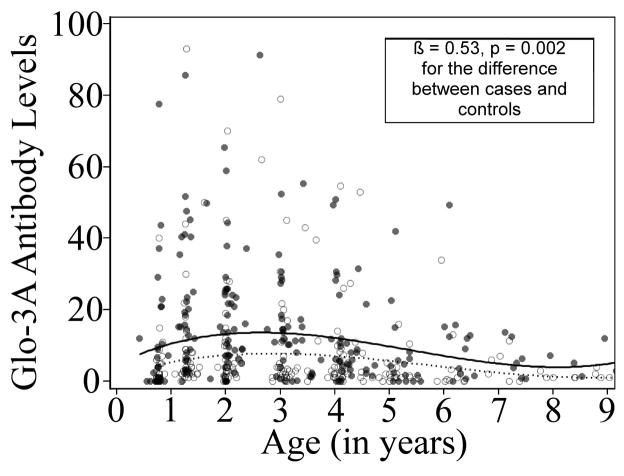
Figure 2.
Glo-3A antibody levels by age in cases and controls. The Glo-3A data are from samples collected prior to and including the first TTG positive visit in cases or the comparable age-matched visit in controls. The solid circles (●) represent actual Glo-3A levels in cases, the solid line is the mean predicted curve for Glo-3A antibody levels by age in cases. The open circles (○) represent actual Glo-3A levels in controls, the dashed line is the mean predicted curve for Glo-3A levels by age in controls. Mixed modeling approaches were used to generate mean predicted curves of Glo-3A antibody levels by age and to test the difference between cases and controls using natural log transformed Glo-3A levels, which accounts for the multiple visits per study subject. The values for the mean predicted curves were then back-transformed for graphing purposes.

