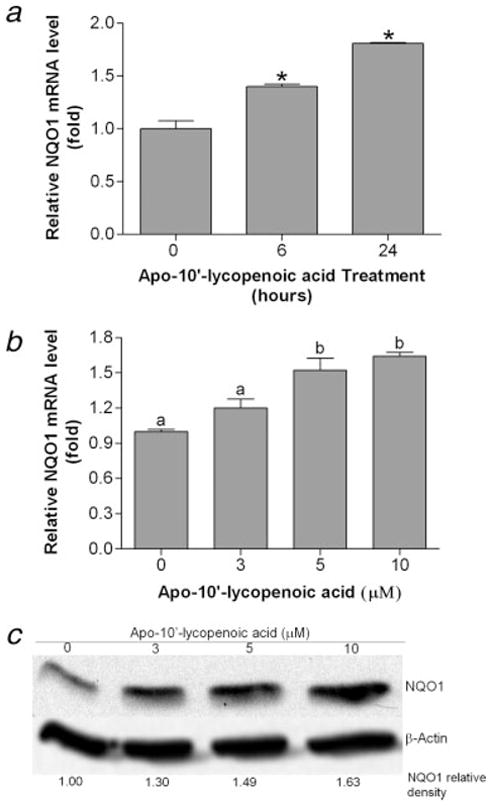
Figure 4.

Induction of NQO1 gene expression by apo-10′-lycopenoic acid. (a) Time-course of NQO1 induction. BEAS-2B cells were treated with 10 μM of apo-10′-lycopenoic acid for 6 and 24 hr. (b) and (c), dose effect of apo-10′-lycopenoic acid on NQO1 induction. BEAS-2B cells were treated with the indicated concentration of apo-10′-lycopenoic acid for 6 hr (b) or 24 hr (c). Transcription level of HO-1 gene was measured by quantitative reverse transcription PCR (a and b) and the protein level was measured by western blot (c). Data in panels (a) and (b) are expressed as mean ± SEM of 3 replicate assays, means that do not share a letter differ, p < 0.05. Panel (c) shows a representative result of at least 3 repeats.
