
Figure 1.
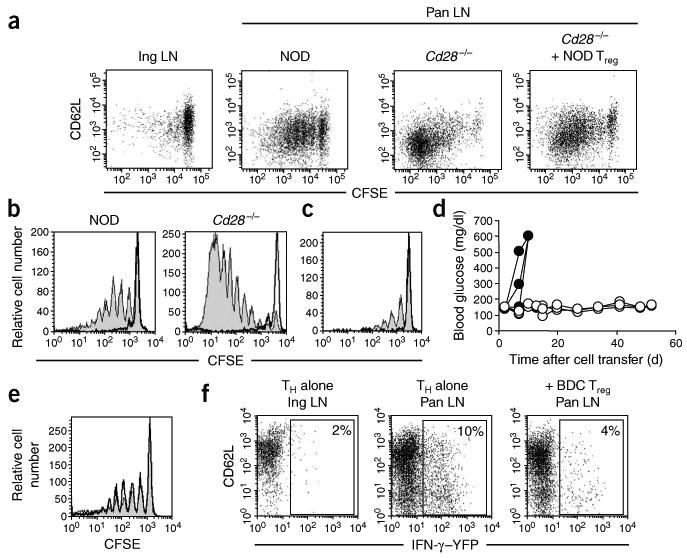
Treg cells suppress the priming of islet antigen–specific CD4+CD25− TH cells in the pancreatic lymph node. (a) CD62L expression and CFSE profiles of CFSE-labeled BDC2.5.Thy-1.1 CD4+CD25− TH cells transferred into NOD (n = 10), NOD.Cd28−/− (n = 10) and Treg cell–reconstituted NOD.Cd28−/− mice (far right; n = 4). Transferred cells in inguinal lymph nodes (Ing LN) of NOD recipients and pancreatic lymph nodes (Pan LN) of all recipients were analyzed. (b,c) CFSE profiles of transferred cells in the pancreatic lymph nodes of NOD and NOD.Cd28−/− mice injected with BDC2.5 Treg cells (bold histograms) or left untreated (filled histograms) 2 d before adoptive transfer of CFSE-labeled Thy-1.1+ BDC2.5 CD4+CD25− TH cells (b) or Thy-1.1+ 4.1 CD4+CD25− TH cells (c). (d) Nonfasting blood glucose of NOD.Rag1−/− mice given CD4+CD25− TH cells from 4.1 TCR-transgenic mice; cells were transferred alone (filled symbols) or together with BDC2.5 Treg cells (open symbols). (e) CFSE profiles of CD4+Thy-1.1+ cells in the pancreatic lymph nodes of NOD mice (n = 10) injected with CFSE-labeled Thy-1.1+ BDC2.5 CD4+CD25− TH cells alone (filled histograms) or together with BDC2.5 Treg cells (bold histograms). (f) YFP expression on CD4+Thy-1.1+ cells in the inguinal and pancreatic lymph nodes of NOD mice (n = 10) given CD4+CD25− TH cells from BDC2.5.Thy-1.1.Yeti mice; cells were transferred alone (CD4+CD25− TH alone) or together with BDC2.5 Treg cells (+BDC Treg). Numbers in dot plots indicate the percentage of YFP+ cells. Data are representative of three or more experiments.