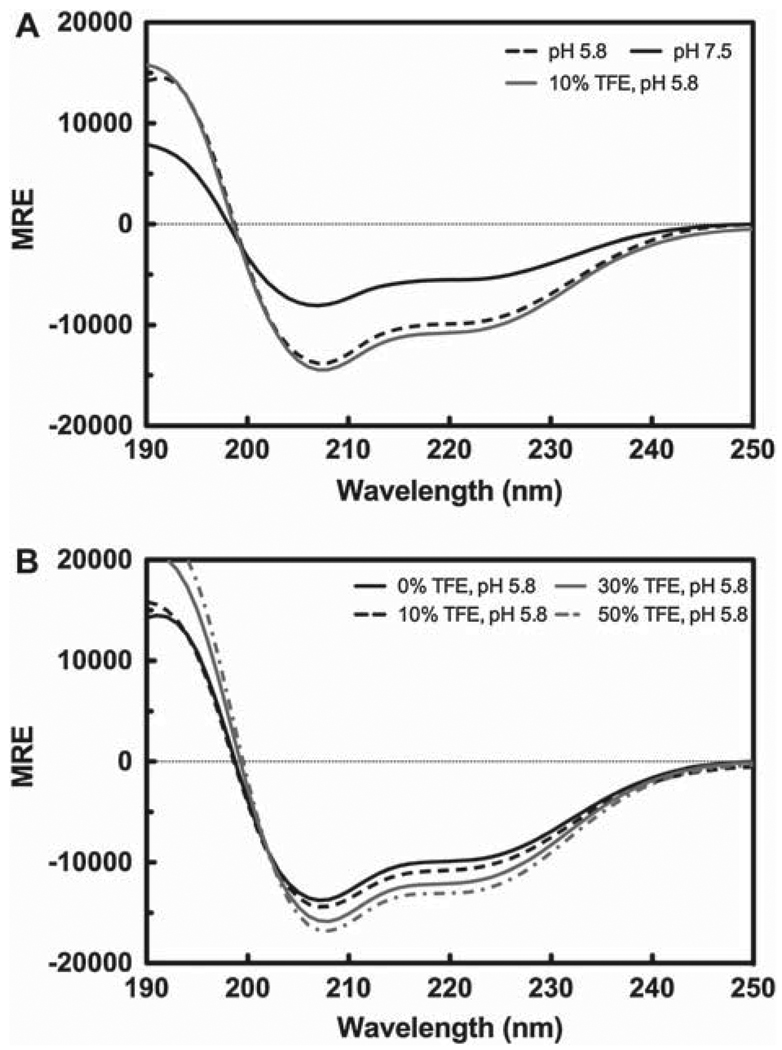
Figure 6.
Circular dichroism (CD) profile of the TM4-Cx43CTΔEL2. CD spectra of the TM4-Cx43CTΔEL2 solubilized in LPPG micelles (MES buffer pH 5.8, 50 mM NaCl, 42°C). (A) CD spectra comparing the secondary structure of the TM4-Cx43CTΔEL2 at pH 7.5 (solid black line) to pH 5.8 (dotted black line) and to pH 5.8 and 10% TFE (solid gray line). (B) CD spectra for the TM4-Cx43CTΔEL titrated with 0% (solid black line), 10% (dotted black line), 30% (solid gray line), and 50% (dotted gray line).

