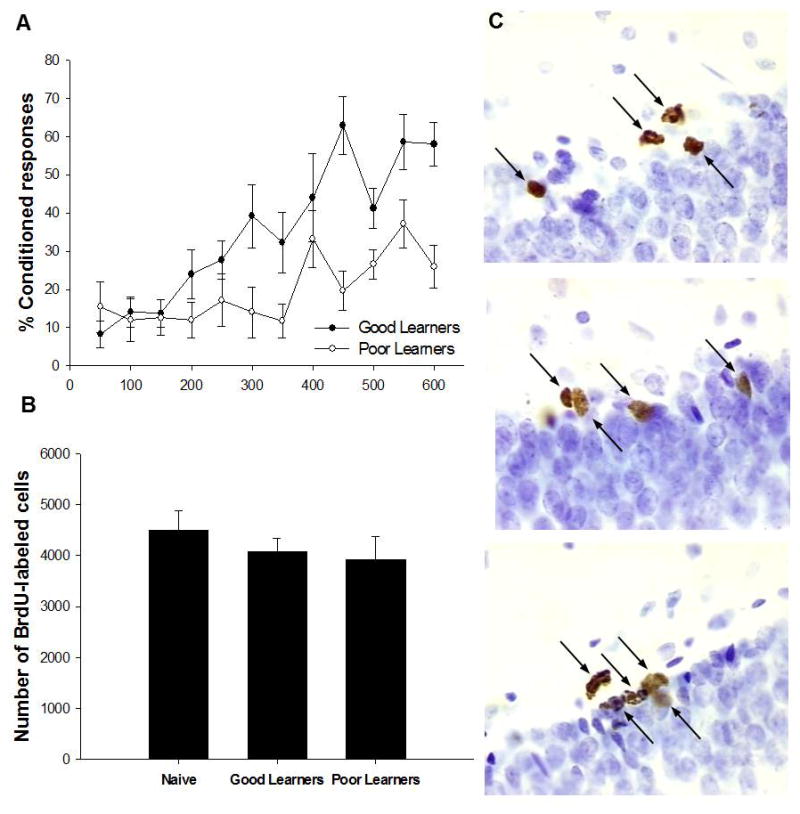
Figure 1. Effects of trace eyeblink conditioning on production of newly generated cells.

Acquisition of trace eyeblink conditioned responses for the good and poor learners (A). Total number of BrdU-labeled cells when animals were trained 30min and sacrificed four days after injection compared to naïve animals. There was no change in the number of cells labeled with BrdU during the training experience (B).Photomicrographs at 100x of BrdU-positive cells (arrows) from a naïve animal (top panel), a good learner (middle panel), and a poor learner (bottom panel) from similar areas along the infrapyramidal DG blade in the dorsal hippocampus. Images represent the differences in the number of BrdU-labeled cells in response to training when compared to naïves (C).
