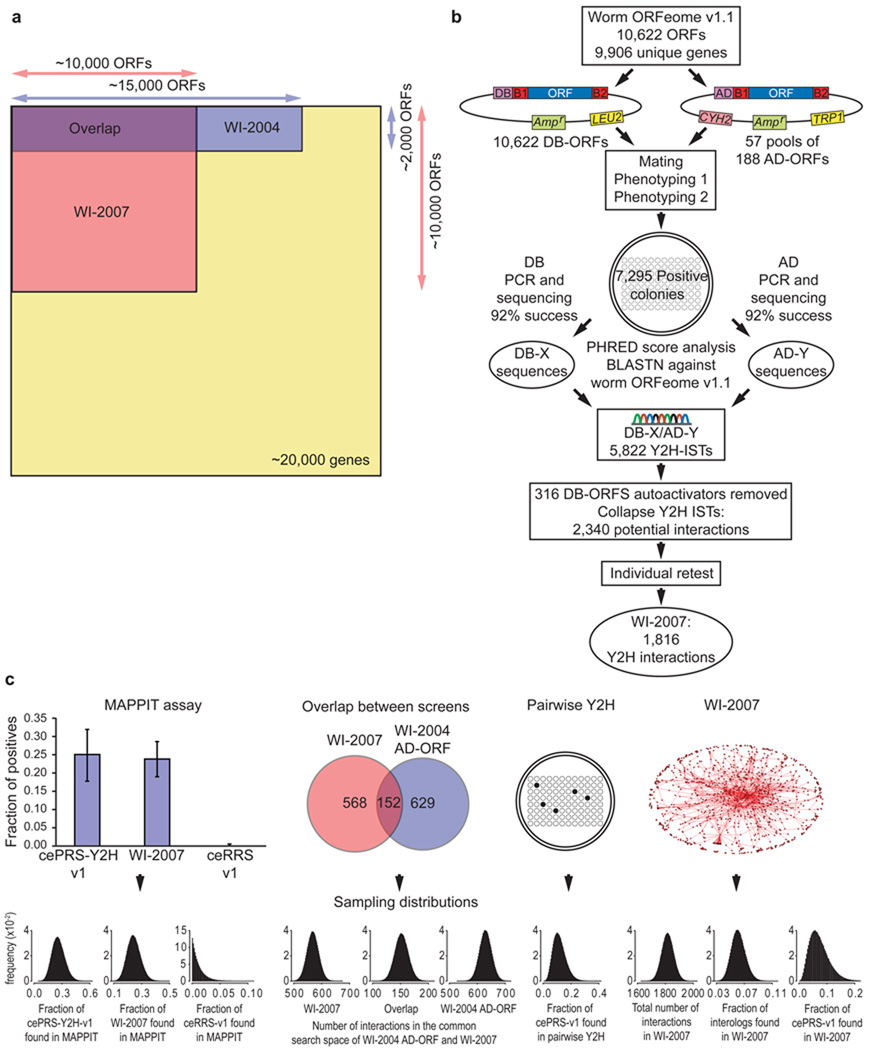
Figure 1.
Construction and characterization of WI-2007. (a) Search spaces of WI-2007 and WI-2004 relative to the whole proteome. WI-2007 results from a 10,000 ORFs matrix screen, which is three times larger than WI-2004, corresponding to one fourth of the entire theoretical search space (screening completeness ~ 24%). (b) Pipeline used for WI-2007. ORFs from ORFeome v1.1 were transferred into DB and AD vectors by recombinational cloning, then transformed into yeast cells. Each bait was then mated with pools of 188 AD-ORFs. Two steps of phenotyping were performed to isolate positive colonies, which were used to PCR-amplify DB-ORFs and AD-ORFs for sequencing, leading to the identification of 5,822 Interaction Sequence Tags (ISTs). After exclusion of autoactivators and collapsing of all ISTs corresponding to the same, non oriented pair, an individual retest was performed to generate the final WI-2007 dataset. (c) WI-2007 characterization. Ten measurements were used (left to right) : proportions of cePRS-Y2H-v1, a random sample of WI-2007 and ceRRS-v1 observed in MAPPIT; number of interactions detected in the common search space of WI-2007 and WI-2004: in WI-2007, in both screens, and in WI-2004 AD-ORF; proportion of cePRS-v1 detected in an independent pairwise Y2H experiment; total number of interactions in WI-2007, proportion of ultra-conserved interologs and cePRS-v1 recovered in WI-2007. The Sampling errors on the 10 measurements are modeled with Beta distributions. Precision, sampling sensitivity, assay sensitivity and the total number of interactions in C. elegans are computed using a Monte-Carlo simulation. Y axis label (frequency) applies to all ten sampling distributions…

