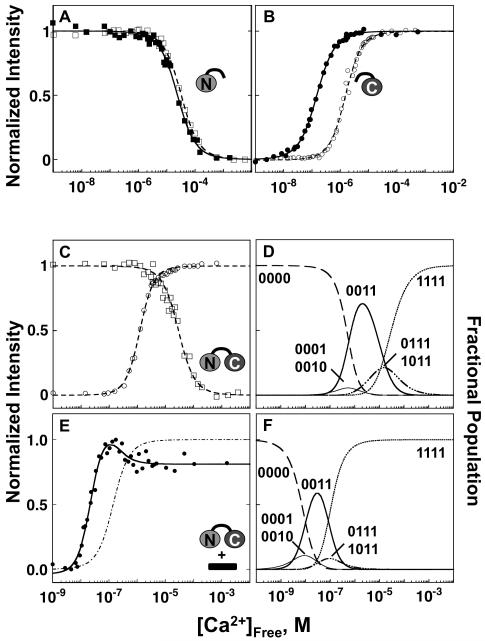
FIGURE 4.
Equilibrium calcium titrations of CaM in the presence and absence of βCaNp. Titrations of 6 μM CaM1-80 (A), CaM76-148 (B), and CaM1-148 (C & E) in the presence and absence of 12 μM βCaNp, as monitored by changes in the fluorescence intensity of Phe (squares) and Tyr (circles). Curves were simulated using the free energies resolved for calcium binding to CaM in the presence (solid symbols and lines) and absence (open symbols, dashed lines) of βCaNp (Table 3). The curve for calcium binding to sites I and II of CaM1-148 in the presence of βCaNp (E, dotted line) was simulated using free energies corresponding to the decreasing phase of the biphasic Tyr signal as described in Materials and Methods and Results sections. The ligation species with population abundances that were > than 0.05 are shown for (D) CaM alone or (F) in the presence of βCaNp.

