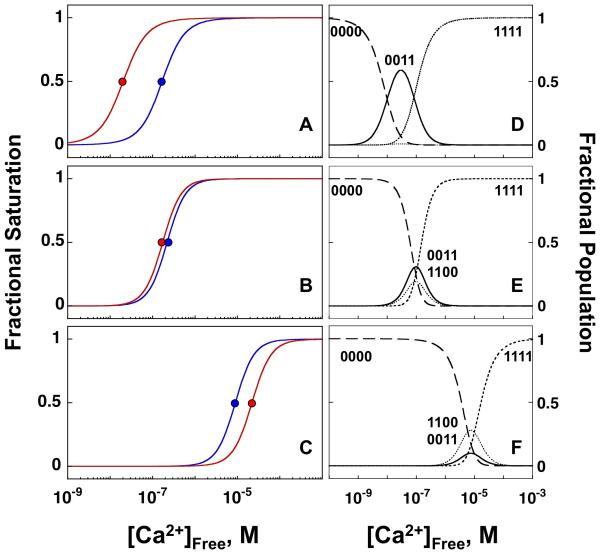
FIGURE 9.
Fractional saturation curves plotted against [Ca2+]Free representing simulations of calcium binding to sites I & II (blue line) and sites III & IV (red line) of CaM1-148 in the presence of (A) βCaNp, (B) CaMKIIp and (C) NaV1.2p with free energies reported in Table 2 (βCaNp), and values previously published for CaMKIIp (Evans & Shea, 2009) and NaV1.2p (Theoharis et al, 2008). The curve for calcium binding to sites I and II of CaM1-148 in the presence of βCaNp (A, red line) was simulated using free energies corresponding to the decreasing phase of the biphasic Tyr signal as described in Materials and Methods and Results sections. The ligation species corresponding to apo (0000), sites I & II filled (1100), sites III & IV filled (0011) and all sites filled (1111) are shown for CaM in the presence of (D) βCaNp, (E) CaMKIIp and (F) NaV1.2p.

