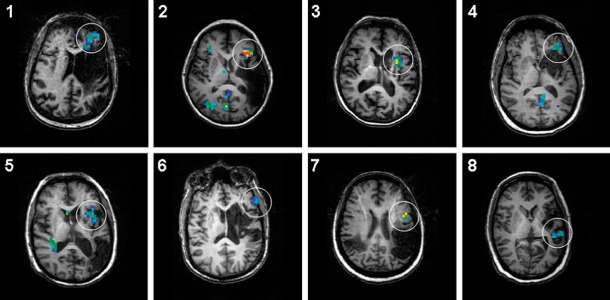
Figure 1.
Individual areas of fMRI activation that correspond to the nerTMS target (white circle) superimposed on individual T1-weighted anatomical images to illustrate the extent of the ischemic strokes and the location of the BOLD signal changes. Subjects 1, 3, 4 and 6 presented with anomic aphasias (1 and 3 had also dysarthria and 6 had conduction aphasia); other subjects presented with non-fluent aphasias, all Broca’s type. All images are in radiological convention (left on the picture corresponds to right in the brain).

