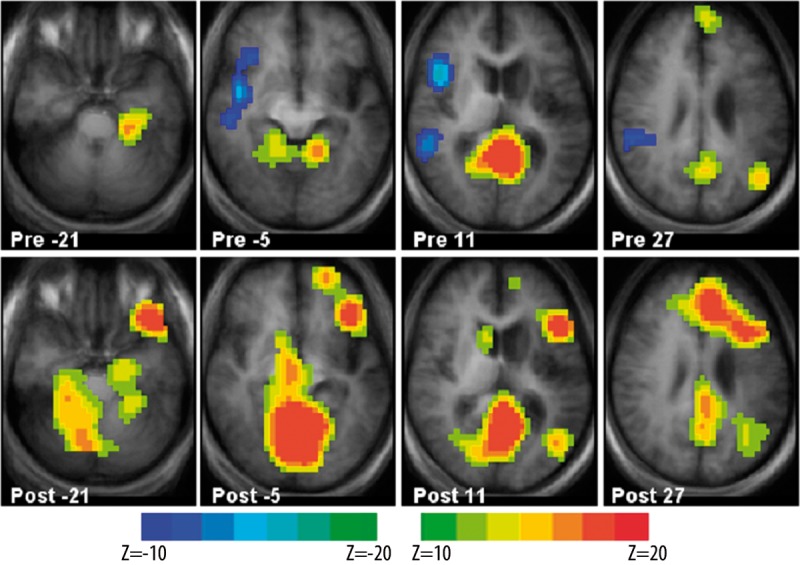
Figure 2.

Group z-score maps for the pre-rTMS (upper row) and post-rTMS (lower row) semantic decision and tone decision fMRI task. Brain regions showing BOLD signal increases for the tone decision > semantic decision contrast are shown in cyan/blue; regions showing BOLD signal increases for the semantic decision > tone decision are shown in yellow/red. BOLD signal changes are significant at an uncorrected p <0.05. Each z-score map is presented in radiological convention, with left on the picture corresponding to the right hemisphere, and are superimposed on an average T1-weighted image generated from all subjects (dilatation of the left lateral ventricle and area of encephalomalacia in the left MCA distribution is clearly seen). Talairach coordinates of the selected slices for each panel range from z=−21 mm (left) to z=+27 mm (right).
