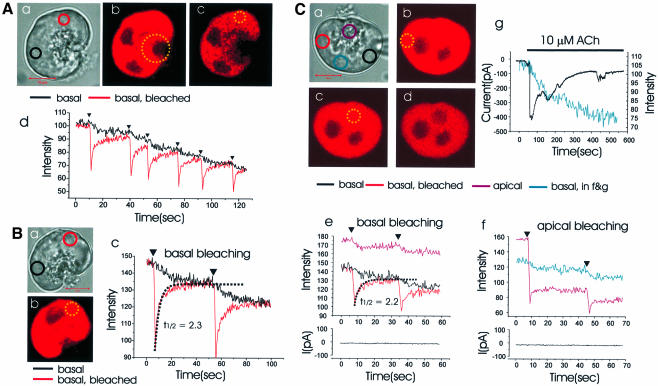
Fig. 2. Time course of Mag-fluo 4 movement in the ER lumen following local bleaching. (A) (a) Transmitted light picture of a single cell with the areas of interest identified by the red and black circles. Length of red bar corresponds to 10 µm. (b and c) Fluorescence intensity images before and after wide apical bleach in region marked by large yellow dotted circle in (b). Local basal bleaching [small yellow dotted circle in (c)] was applied repeatedly and the fluorescence intensities measured both in the bleached area [red circle in (a), red curve in (d)] as well as in an unbleached basal area ∼10 µm away [black circle in (a), black curve in (d)]. (B) (a) Transmitted light picture of another cell. Local basal bleaching [red and yellow dotted circles in (a) and (b), respectively] was applied and the fluorescence intensity changes in the marked sites [colour coding corresponds to coloured circles in (a)] are shown in (c). (C) In this experiment Mag-fluo 4 was washed out of the cytosol through a patch pipette (a) (whole-cell configuration). Ten minutes after establishing whole-cell configuration, the areas represented by the dotted yellow circles (b and c) were bleached and the fluorescence intensity changes monitored in the areas represented by the marked circles in (a). (a) Transmitted light picture; (b and c) before and after basal bleaching, respectively; (c and d) before and after apical bleaching. The time course of the changes in fluorescence intensity [colour coding according to the marked sites in (a)] and the Ca2+-dependent whole-cell current during the local basal (b) and apical (c) bleaching are shown in (e) and (f), respectively. After the bleaching experiments, ACh elicited an increase in the Ca2+-dependent current (black trace) and released Ca2+ from the ER (blue trace) (g).

An official website of the United States government
Here's how you know
Official websites use .gov
A
.gov website belongs to an official
government organization in the United States.
Secure .gov websites use HTTPS
A lock (
) or https:// means you've safely
connected to the .gov website. Share sensitive
information only on official, secure websites.
