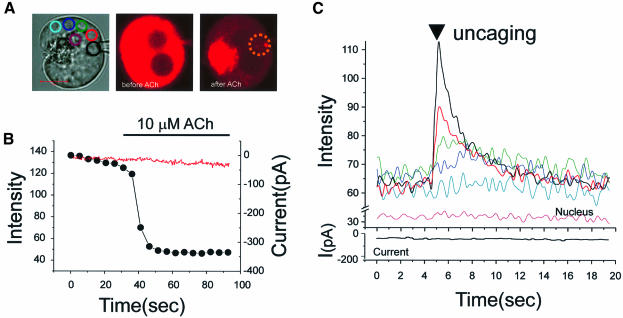
Fig. 3. Rapid movement of Ca2+ in the ER lumen following local uncaging of caged Ca2+. Direct measurement of Ca2+ movement in the lumen ofthe ER. After 30 min loading with Mag-fluo 4-AM and NP-EGTA-AM, the dye and NP-EGTA were washed out of the cytosol into a patch pipette (whole-cell configuration). The cytosolic Ca2+ was clamped at the resting level by using a patch pipette containing 10 mM BAPTA and 2 mM Ca2+. Thereafter, 10 µM ACh was applied to lower the Ca2+ concentration inside the ER. (A) Transmitted light image of the cell with the patch pipette. The various regions of interest are colour coded. The fluorescence intensity images just before and after ACh application are also shown. NP-EGTA was uncaged in the lumen of the ER in the area represented by the dotted circle. (B) Time course of the ACh-evoked reduction in Ca2+ concentration inside the ER (black dots) and also the complete absence of any change in the Ca2+-dependent Cl– current (red trace). (C) Time course of the Ca2+ concentration changes in the ER, following local uncaging, in the various regions colour coded in (A). It is also seen that the Ca2+-dependent current did not change after the intralumenal uncaging.

An official website of the United States government
Here's how you know
Official websites use .gov
A
.gov website belongs to an official
government organization in the United States.
Secure .gov websites use HTTPS
A lock (
) or https:// means you've safely
connected to the .gov website. Share sensitive
information only on official, secure websites.
