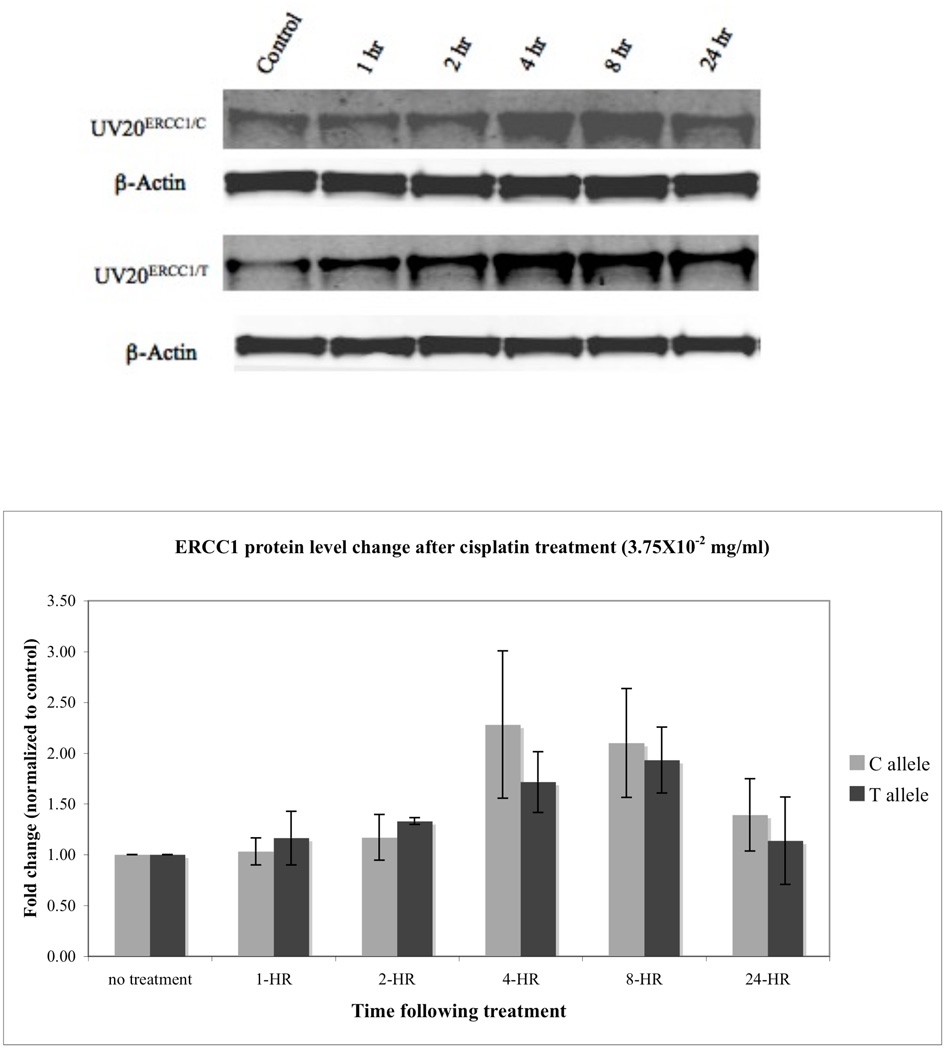
Figure 3.
ERCC1 expression levels in UV20ERCC1_C and UV20ERCC1_T cell lines following cisplatin treatment did not show difference. Upper panel: Western blots for ERCC1. Lower panel: Quantification of ERCC1 expression change following cisplatin treatment. Data are mean ± SD obtained from three independent experiments. The expression levels of ERCC1 in the control cells pre-treatment were arbitrarily assigned 1. The change in ERCC1 level is expressed as the fold change compared to untreated cells. Data were normalized for equal loading.

