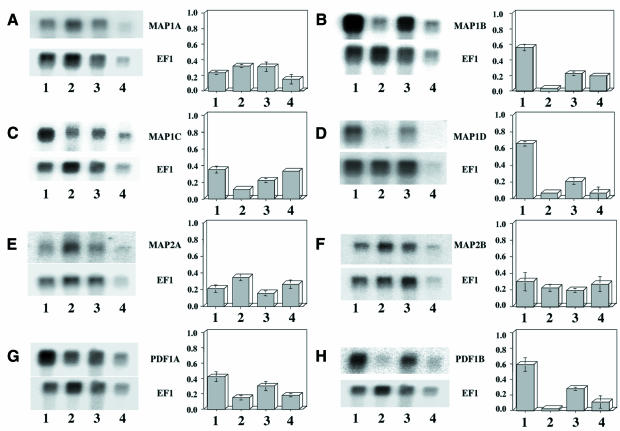
Fig. 3. Expression of various MAP and PDF mRNAs in A.thaliana tissues. Two micrograms of poly(A)+ mRNAs were resolved by gel electrophoresis and analyzed by northern blotting as described in Materials and methods. The specific activity of the probe was in most cases ∼1 × 10⁹ d.p.m./µg. Lane 1, leaves; lane 2, roots; lane 3, flowers; lane 4, siliques. Exposure was over 4 days. In each case, the blot was further re-hybridized with the elongation factor 1α probe (bottom) and exposed for 5 h. A fluorograph is shown for each specific transcript (PDF or MAP, top; EF1α, bottom). The table next to each panel is the average ratio of the intensity of the probe of interest to that of EF1α for three experiments. (A) MAP1A; (B) MAP1B; (C) MAP1C; (D) MAP1D; (E) MAP2A; (F) MAP2B; (G) PDF1A; (H) PDF1B.

An official website of the United States government
Here's how you know
Official websites use .gov
A
.gov website belongs to an official
government organization in the United States.
Secure .gov websites use HTTPS
A lock (
) or https:// means you've safely
connected to the .gov website. Share sensitive
information only on official, secure websites.
