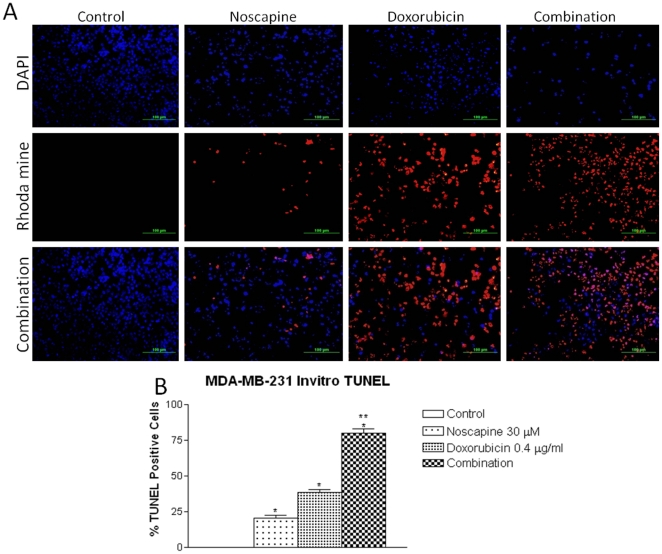
Figure 1. Fluorescence Micrographs of cells stained with rhodamine and DAPI after 72 h (A) with Doxorubicin 0.4 µg/ml , Noscapine 30 µM, and, Noscapine and Doxorubicin combination in MDA-MB-231 cells and (B) Quantitation of apoptotic MDA-MB-231 cells from TUNEL assay.
DNA fragmentation indicated by positive staining (red) and nuclear condensation indicated by DAPI nuclear staining (blue). Micron bar = 100 µm. Cells were quantitated by counting 100 cells from 6 random microscopic fields. Data are expressed as mean+SD (N = 6). One-way ANOVA followed by post Tukey test was used for statistical analysis to compare control and treated groups. * P<0.01; all treatments significantly different from control and ** P<0.01; significantly different from Noscapine and Doxorubicin single treatments.

