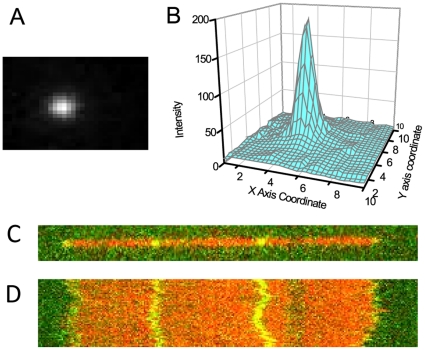
Figure 1. Measurement of the fluctuations of the internal segments of confined DNA.
(A) Image of a dye label (Alexa-546) on a DNA backbone (backbone not shown) with  ms exposure time. (B) 2D surface plot of the raw image (intensity of the dye vs. the X Y coordinates). (C) Image of one T4 DNA fragment (
 36 microns) with backbone (red) and internal labels (green). (D) Time series (8 seconds) of the DNA showing the fluctuations of backbone and internal labels. In (D), the red trace is the backbone and the green traces are the trajectories of internal dye labels.

