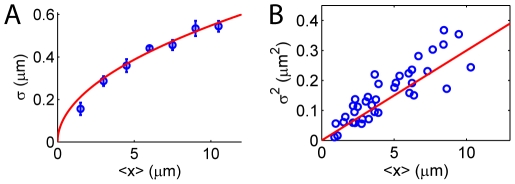
Figure 2. Internal fluctuation of  DNA confined in a 80 nm
 130 nm channel.
(A) The measured rms fluctuation  versus mean extension
  for the internal segments of the DNA agrees very well with de Genne's theory with no fitting parameters (red curve, Eq.4). (B) A linear
  profile confirms the
  power law of
  of the de Gennes' theory. Note, however, that here we have maximum
  m. As shown in a subsequent figure (Fig. 4) and in the text, for longer polymer with a maximum
  m, the data deviates significantly from de Gennes' theory and even the 0.5 power law is lost.

