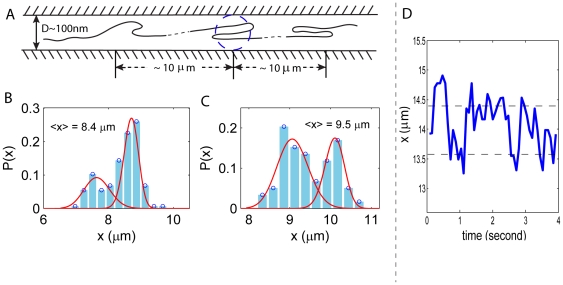
Figure 6.
(A) Folded structures in the backbone of confined DNA. Each branch of the structure is about  nm, about the width of the channel size. The structures are separated by a distance
  10
10  m. (B, C) Distribution of extension
  for 2 internal segments that contain the folded structures. In disagreement with de Gennes' prediction, the distributions show 2 peaks, from which we infer the existence of the folded structures. However, the structures are not stable as the two peaks in the distributions are comparable in height. The red curves fitted to the left peaks on the histogram are from de Gennes' theory (Eq.7) and the ones superimposed on the right peaks are from the deflection theory (Eq.10). (D) Extension
  versus time for a single internal segment that shows two peaks in the distribution
  . The extension of this particular internal segment seems to fluctuate around two values shown by the dashed lines. This gives rise to the two peaks seen in the probability distribution.

