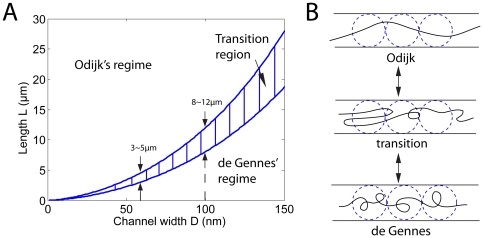
Figure 7.
(A) Phase diagram showing two regimes on the  plane, assuming
  nm for DNA. Transition from de Gennes' to Odijk's regime can occur when
  decreases with
  fixed, or when
  increases with
  fixed. (B) DNA with local folded structures as an intermediate state between de Gennes's and Odijk's regimes. In experiments, we observe heterogeneity in the intensity profile of YOYO-1 dye along the backbone of a confined DNA, which suggests the existence of the local folded structures (see Supporting Information Fig. S2).

