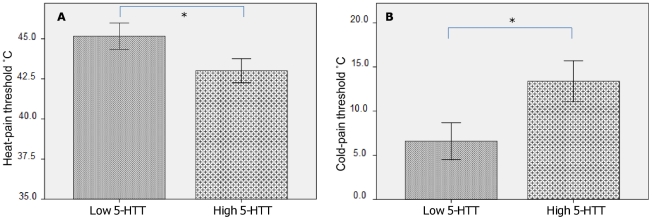
Figure 2. Thermal pain thresholds.
A) Heat-pain thresholds. The difference between average heat-pain threshold for the high- versus the low 5-HTT-expressing groups was significant [U = 155.0, z = −2.03, p = 0.02, one-tailed test]. B) Cold-pain thresholds. The difference between average cold-pain threshold for the high versus the low 5-HTT-expressing groups was significant [U = 162.0, z = −1.91, p = 0.03, one-tailed test].

