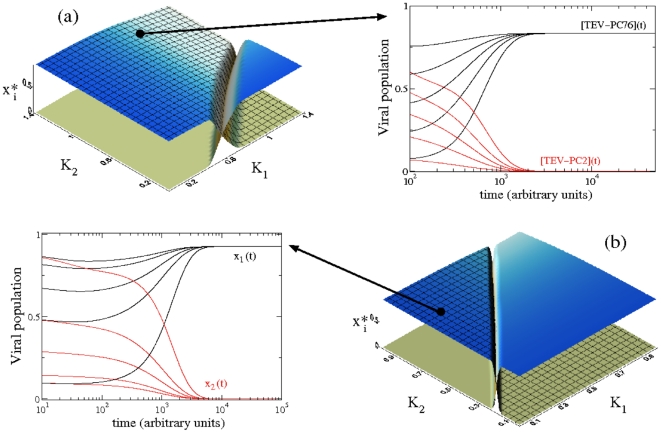
Figure 4. Dependence of the outcompetition dynamics on the fitness of each virus population (rmax,i) and on the affinities to the cellular factor Ki (i.e., virulence).
(a) Equilibrium concentration numerically obtained for x 1 (gridded surface) and x 2 (flat surface) shown in the parameter space (K 1, K 2) using the mean values of fitness experimentally characterized: rmax ,1 = 1.07 (TEV-PC76) and rmax ,2 = 0.621 (TEV-PC2), using x 1(0) = x 2(0) = 0.5. The dynamics is shown on the right hand side using the virulence parameters characterized for the same strains in Carrasco et al. (2007), which are indicated by the large arrow and given by: K 1 = 0.818 (TEV-PC76, black trajectories for x 1) and K 2 = 1.221 (TEV-PC2, red trajectories for x 2). Note that x 1 asymptotically outcompetes x 2, independently of the initial condition. (b) Same as in (a) but using rmax ,1 = 0.85 and rmax ,2 = 1. Note that for this case, as in the previous one, the hypovirulent virus can displace the hypervirulent one, even if the former has a lower replicative fitness. The time series show, for five different initial conditions, the dynamics for the values of virulence indicated with the arrow, given by K 1 = 0.2 and K 2 = 0.7.

