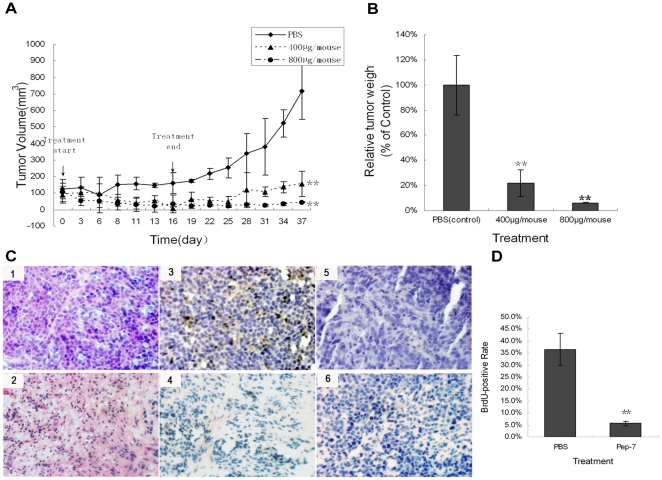
Figure 7. The anti-tumor efficacy of Pep-7 in vivo.
Mice bearing subcutaneous tumors were treated for 16 days with intravenous injections of PBS (control) or Pep-7 at doses indicated every other days. Results represent means ± SE. (A) Tumor growth curve. Tumor volume was calculated using the formula “volume = length×width2/2,” (B) Tumor growth inhibition ratio, represented as relative tumor weight to control. Relative tumor weight (% of control) = average tumor weight of each dose treatment group/average tumor weight of control group”; (C) H/E staining and BrdU-incorporation staining of tumor tissues. (1) H/E staining of section from PBS treatment group; (2) H/E staining of tumor tissue from 400 µg Pep-7 treatment group; (3) BrdU antibody staining of section from mouse up-taking BrdU in PBS treatment group; (4) BrdU antibody staining of section from mouse up-taking BrdU in 400 µg Pep-7 treatment group; (5) BrdU antibody staining of section from mouse without up-taking BrdU in PBS treatment group (6) PBS staining of section from mouse up-taking BrdU in PBS treatment group; (D) statistical data of the BrdU-positive cells by accounting for 1000 total cells in each case (*, p<0.02; **, p<0.01; Original magnification, 200×).

