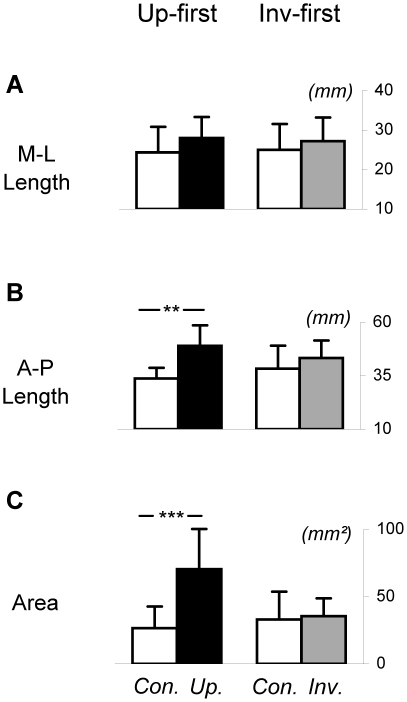
Figure 4. Mean lengths and area of CoP excursions: comparison between groups Up-first and Inv-first.
Panels A, B and C respectively show mean medio-lateral length, antero-posterior length and area covered by CoP excursions in the Control and Upright conditions for Group Up-first, and Control and Inverted conditions for group Inv-first. Bars indicate standard deviations, ** and *** mean significant differences between conditions (respectively p<0.01 and p<0.001). Con. = Control condition, Up. = Upright condition, Inv. = Inverted condition. As can be seen, A-P CoP displacement and CoP area were significantly higher in the Upright condition compared to the Control condition for Group Up-first. No significant difference was detected between the Inverted and Control conditions for group Inv-first.

