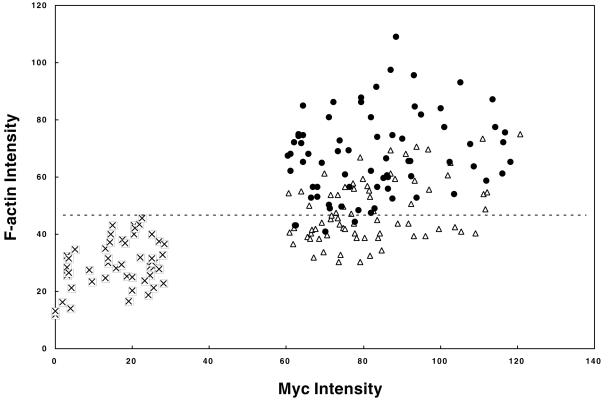
Figure 8.
Quantitative fluorescence measurement of myc and phalloidin staining intensities of mock-transfected (⊠), wild-type caldesmon-expressing (▵), and 7th mutant caldesmon-expressing (●) cells. Mean fluorescence intensities (arbitrary unit) of cells expressing caldesmon were quantitated with NIH image software. The dashed line in the figure shows a maximum fluorescent intensity of phalloidin staining of mock-transfected cells, intensities above which are judged to have higher F-actin staining than control.

