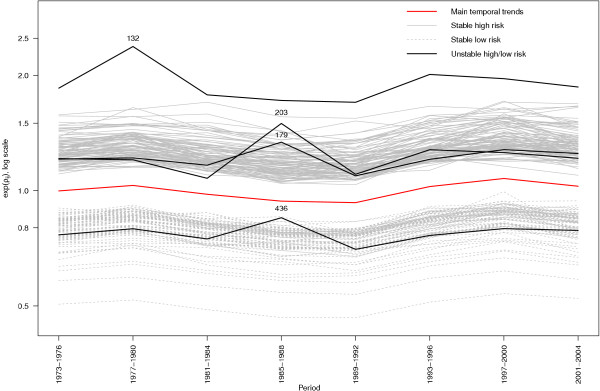
Figure 4.
Posterior medians of the relative risks in each period, both genders. Figure 4 displays the posterior medians of relative risks exp(ρij) in each period. Three areas (ID 132, 179, 203) out of the 96 high risk areas have unusual temporal patterns. One area (ID 436) out of the 82 low risk areas has an unusual temporal patterns.

