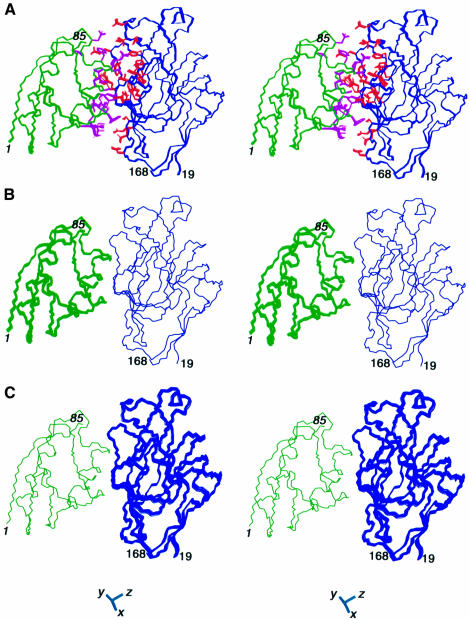
Fig. 2. The structure of the E.coli HPr–IIAGlc complex. Three sets of superpositions are shown. (A) The structures are best fitted to all the backbone atoms; the backbone and side chains of HPr are shown in green and magenta, respectively, and the backbone and side chains of IIAGlc are shown in blue and red, respectively. (B) The structures are best fitted to the backbone atoms of IIAGlc only. (C) The structures are best fitted to the backbone atoms of HPr only. The latter two superpositions illustrate the precision with which the orientation of one molecule is determined relative to the other. Residues from HPr are denoted in italic. The axis of the alignment tensor is shown at the bottom of the figure.

An official website of the United States government
Here's how you know
Official websites use .gov
A
.gov website belongs to an official
government organization in the United States.
Secure .gov websites use HTTPS
A lock (
) or https:// means you've safely
connected to the .gov website. Share sensitive
information only on official, secure websites.
