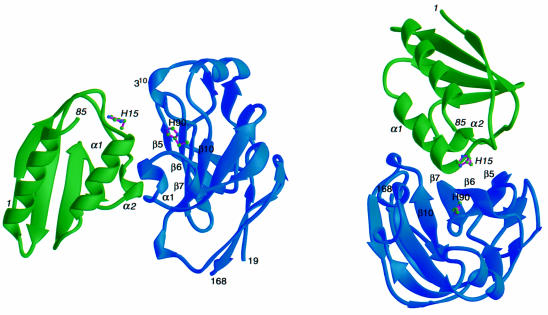
Fig. 3. Ribbon diagram showing two views of the E.coli HPr–IIAGlc complex. HPr is in green, IIAGlc in blue and the location of the active site histidines, His15 of HPr and His90 of IIAGlc, is indicated. Residues from HPr are denoted in italic. The secondary structure elements in the vicinity of the interface are indicated.

An official website of the United States government
Here's how you know
Official websites use .gov
A
.gov website belongs to an official
government organization in the United States.
Secure .gov websites use HTTPS
A lock (
) or https:// means you've safely
connected to the .gov website. Share sensitive
information only on official, secure websites.
