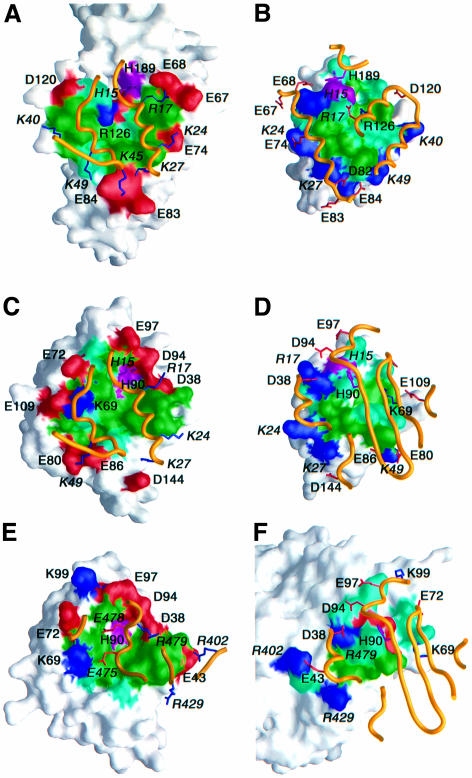
Fig. 6. Surface representations illustrating the binding surfaces involved in the (A and B) EIN–HPr, (C and D) HPr–IIAGlc and (E and F) IIAGlc–GK complexes. The HPr binding surface on EIN and IIAGlc are shown in (A) and (C), respectively; the EIN and IIAGlc binding surfaces on HPr are shown in (B) and (D), respectively; the GK binding surface on IIAGlc is shown in (E); the IIAGlc binding surface on GK is shown in (F). The binding surfaces are color coded with hydrophobic residues in green, polar residues in light blue, the active site histidines in purple, positively charged residues in dark blue and negatively charged residues in red. The relevant portion of the backbone of the partner protein is shown as a gold ribbon with positively charged side chains in dark blue and negatively charged ones in red. Only charged residues and the active site histidines are labeled, with residues from HPr and GK denoted in italic. Note that although the active site histidines of EIN (His189) and IIAGlc (His90) are in close contact with His15 of HPr, their direction of approach is different: His189 (EIN) approaches His15 from above (B), while His90 (IIAGlc) approaches His15 from below (D). The coordinates for the EIN–HPr and IIAGlc–GK complexes are taken from Garrett et al. (1999) (RCSB accession code 3EZA) and Hurley et al. (1993) (RCSB accession code 1GLA).

An official website of the United States government
Here's how you know
Official websites use .gov
A
.gov website belongs to an official
government organization in the United States.
Secure .gov websites use HTTPS
A lock (
) or https:// means you've safely
connected to the .gov website. Share sensitive
information only on official, secure websites.
