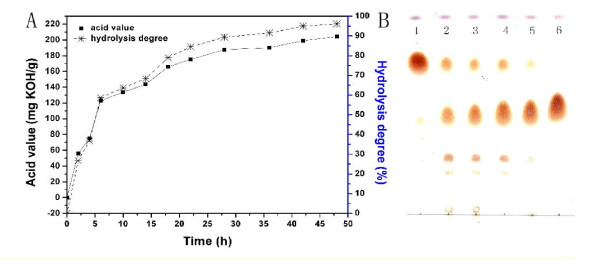
Figure 2.
Time course of hydrolysis reaction. (A) Time course of acid value and hydrolysis degree. Chromatography at various time points (time point 1, 0 hour; time point 2, 6 hours; time point 3, 12 hours; time point 4, 24 hours; time point 5, 36 hours; time point 6, 48 hours). (B) Time course of composition of oil phase during hydrolysis reaction analyzed as described in Methods. Thin layer chromatography analysis of (top to bottom) triglycerides, fatty acids, diglycerides and glycerol monoesters. The reaction system comprised 200 g of soybean oil, 20,000 Uw lipase broth, 120 g of water and 10 g of sodium stearate at 40°C for 36 hours and spun at 180 rpm.

